
Scout Moor 1 Wind Farm Performance Data
In this post I have pulled together key performance data (load factor, ROCs and power generated) for SM1 from the following sources:
https://rer.ofgem.gov.uk/ (Only works during business hours!)
and the following site for Load factors,
https://www.ref.org.uk/generators/index.php
Thanks to David Turver and Nick RL over on SubStack who put me onto these information sources. Thanks also to the Renewable Energy Foundation for providing this data, this is an incredible resource, much of which is provided free of charge.
This is the page for Scout Moor 1 which has the ID: R00200RQEN: G01481NWEN
Basic Site Data
| Subsidy scheme | RO |
|---|---|
| Accreditation | 1st Jan 2008 |
| No Turbines | 26 |
| Turbine model | Nordex N80 |
| Hub height | 60m |
| Blade diameter | 80m |
| Total height | 100m |
| Turbine capacity | 2.5 MW |
Summary Performance Data
| Period | Capacity (kW) | Load Factor | MWh | ROCs |
|---|---|---|---|---|
| 2008/2009 (10) | 65,000 | 16.6% * | 78,565 | 78,565 |
| 2009/2010 | 65,000 | 25.1% | 142,749 | 142,749 |
| 2010/2011 | 65,000 | 23.1% | 131,617 | 131,617 |
| 2011/2012 | 65,000 | 30.1% | 171,884 | 171,884 |
| 2012/2013 | 65,000 | 29.2% | 166,348 | 166,348 |
| 2013/2014 | 65,000 | 31.8% | 181,319 | 181,319 |
| 2014/2015 | 65,000 | 27.3% | 155,339 | 155,339 |
| 2015/2016 | 65,000 | 30.0% | 171,455 | 171,455 |
| 2016/2017 | 65,000 | 25.4% | 144,712 | 144,712 |
| 2017/2018 | 65,000 | 29.3% | 166,931 | 166,931 |
| 2018/2019 | 65,000 | 25.6% | 145,955 | 145,955 |
| 2019/2020 | 65,000 | 29.6% | 169,267 | 169,267 |
| 2020/2021 | 65,000 | 30.1% | 171,170 | 171,170 |
| 2021/2022 | 65,000 | 24.1% | 137,313 | 137,313 |
| 2022/2023 | 65,000 | 26.3% | 149,946 | 149,946 |
| 2023/2024 | 65,000 | 28.2% | 160,739 | 160,739 |
| 2024/2025 (8) | 65,000 | 22.3% * | 84,937 | 76,183 |
| Annual Totals to end Nov-24 | 159,037 | 150,283 | ||
| Rolling Load Factor | 27.5 % | |||
| Annual Load Factor to end Nov-24 | 27.9 % | |||
Notes
- Period is the 12 months from 1 April to 31 March
- Capacity is the total installed generating capacity in kW
- Load Factor is calcuated for the 12 months of the period.
- An asterisk (*) denotes fewer than 12 months of data is available in a given period; the actual number of months of data is in brackets in the first column.
- The number of ROCs per MWh depends on whether the generator is subsidised under the RO and, from April 2009, the band into which the generator and technology falls.
Monthly Load Factor
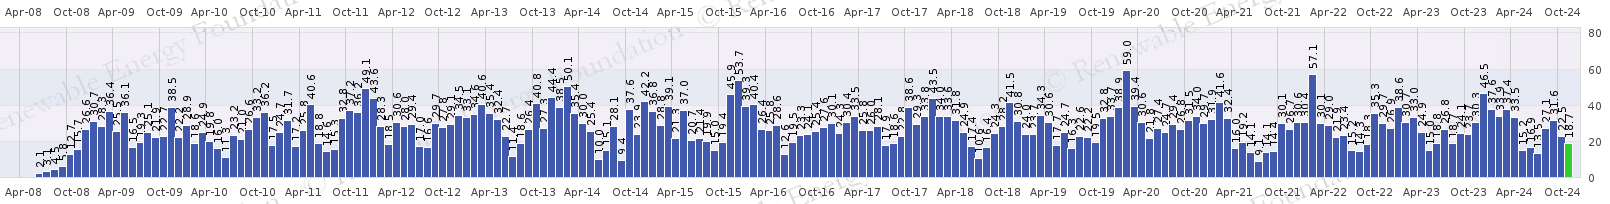
Source: Renewable Energy FoundationNotes
- The graph shows monthly load factors from the earliest generation date of June 2008. Click on the graph to view in a separate window.
- Blue bars are derived from RO data, red from CfD data, green from REGO data; yellow bars from BM data; grey bars from LEC data.
- The numbers give the monthly load factors.
Monthly Energy Output
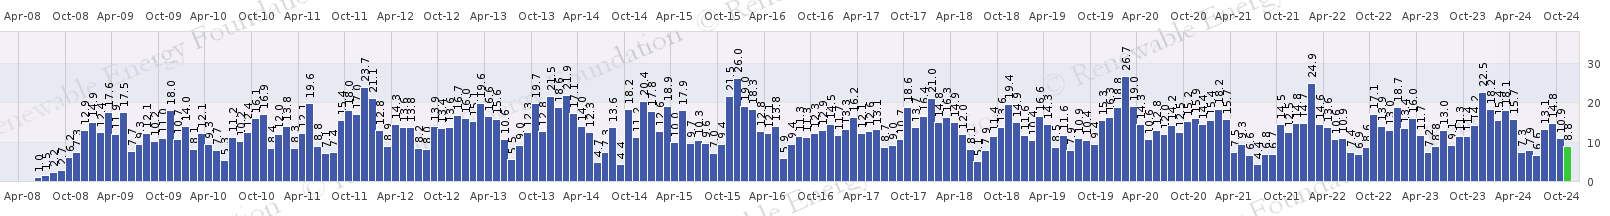
Source: Renewable Energy Foundation
Notes
- The graph shows monthly energy output from the earliest generation date of June 2008. Click on the graph to view in a separate window.
- Blue bars are derived from RO data, red from CfD data, green from REGO data; yellow bars from BM data; grey bars from LEC data.
- The numbers give the output in MWh or GWh as indicated by the y axis label.
Some thoughts on this data
- In my 3D-turbine map I have assumed that the existing turbines are 115m high, when they are 100m. This does mean that I have to update the map.
- The power output varies in step with the load factor which is what you would expect.
- The rolling load factor is 27.5%, i.e. of the 65MW capacity it produces less than 18MW on average!
- This average hides significant variations, being as low as 23.1% in 2010/11, i.e. producing only 15MW!
- A typical home requires about 8 MWh/year which means at 15MW output, SM1 could power 16,475 homes (see calculation below)
- I haven’t been able to get the specific ROC prices yet but a quick Chat-GPT query suggests each certificate has a value of around £55 which means from the data above that SM1 has received a ROC income of nearly £140M. The cost of these ROCs is paid for by non-renewable electricity suppliers who of course have to include this element in our electricity bills. Also note that SM1 receives income from the actual electricity produced.
Power usage calculation
The total homes that can be supplied is calculated as follows:
Power rating in MW x 24hours/day x 365days/year
Annual consumption MWh/year